Instructions for Using the Bayesian Score Predictor (BSP)
Using the Bayesian Score Predictor
The Bayesian Score Predicator (BSP) is designed to provide family medicine residents and program directors with an estimate of the resident’s probability of passing the certification examination when they take it at the end of their 3rd year of residency. The BSP user interface has 6 connected boxes (Figure 1). The first box represents either a resident’s COMLEX-USA Level 2 CE score or their USMLE Step 2 CK score. The next 3 boxes represent a resident’s In-Training Examination (ITE) scores, one for each year of residency. The fifth box represents a resident’s certification exam score and the last box represents their probability of passing.
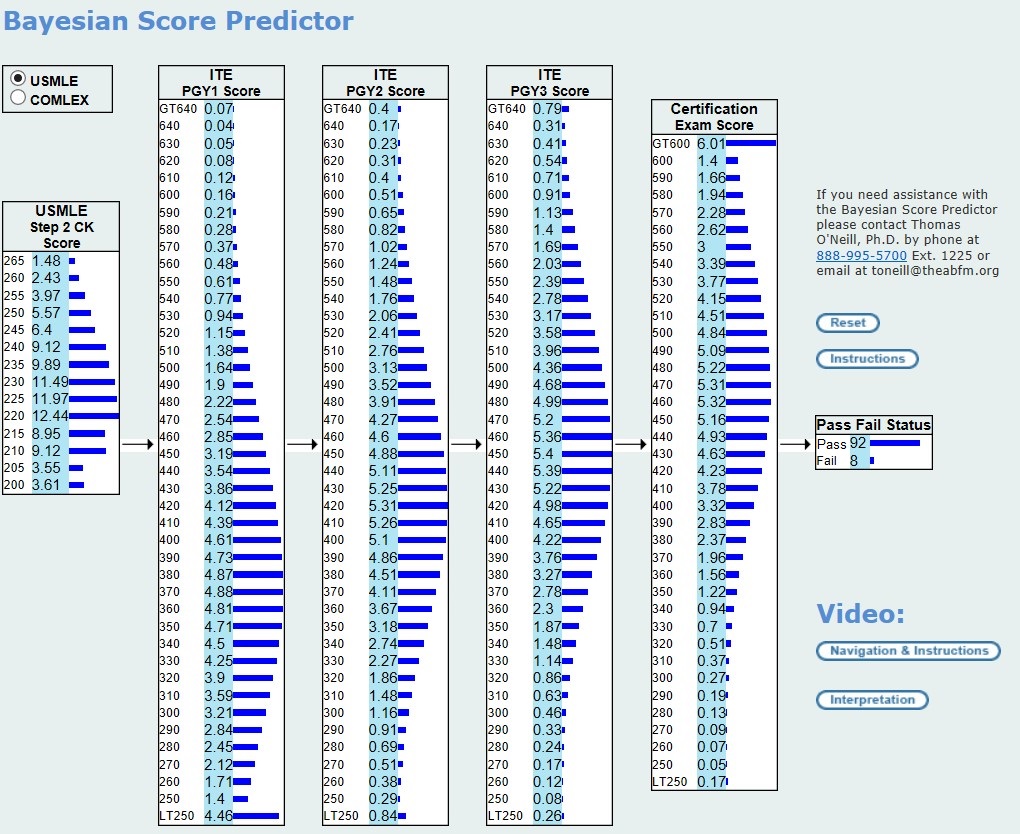
There is also a box in the upper left-hand corner that permits the user to select whether they want the USMLE Step 2 CK or the COMLEX-USA Level 2 CE to be used for the licensing examination score. You can choose either one or you can switch between the two, but you cannot use both simultaneously.
In its initial state, each box is populated with the expected distribution of scores for the licensing examination, the ITE, and the certification examination. However, if the user clicks on a score in any one of these boxes, it changes from the expected distribution of scores to a single observed score. Note, observed scores have 100% probability of happening because they actually happened.
Clicking on a score in any box will cause the distribution of scores in the boxes to the right to be updated with the distribution of expected scores (certification and/or ITE) for examinations that are scheduled for later in the process. These revisions represent the probabilities that are expected based upon only those people who received the designated observed score.
For example, if a resident scored a 270 in their 2nd year of residency, the user would click on 270 in the PGY2 box. This will: (1) change the PGY2 distribution to 100% for the score of 270 and (2) change the expected score distributions for PGY3 and for the certification examination to reflect the probabilities given an observed score of 270 in PGY2. You can see that this also updates the probability of passing the certification examination.
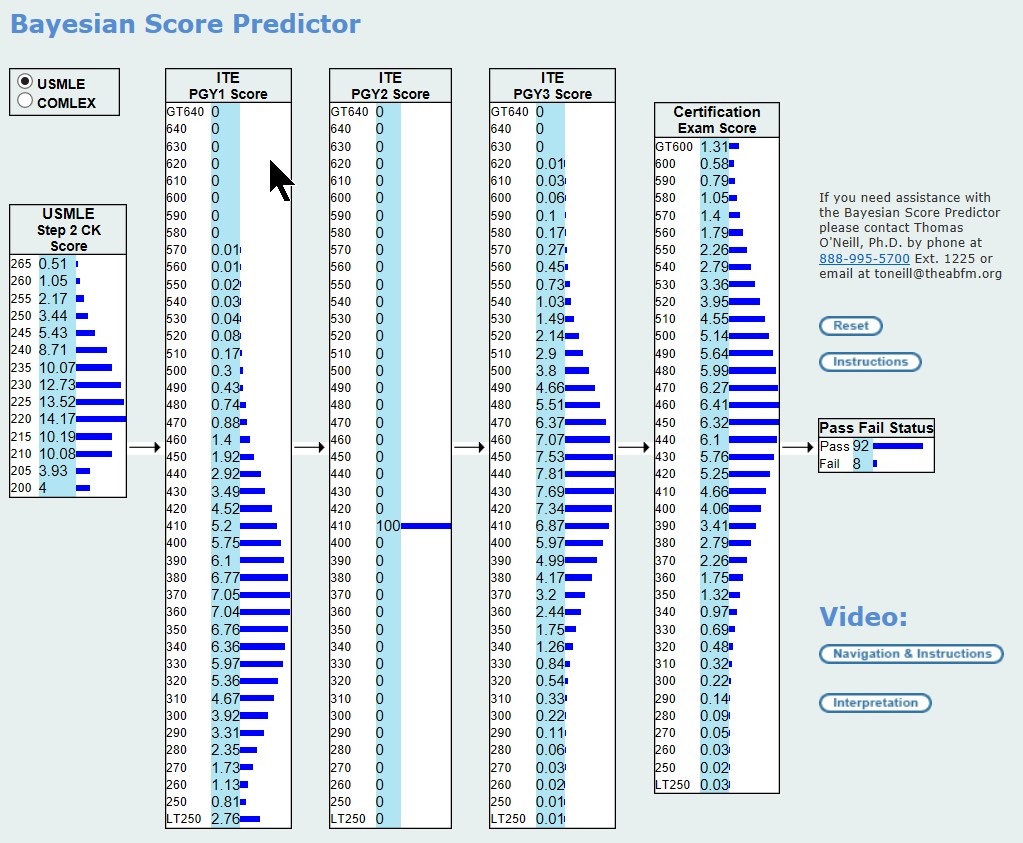
Clicking on a different PGY2 score, say 410 (see Figure 2), the BSP will change the observed score to 410 and update the distributions and probabilities accordingly. Clicking on 410 a second time will restore the original default distribution for PGY2.
It is important to note that if you select a score for PGY1 and another score for PGY2, the PGY2 score overrides the PGY1 score with regard to updating the distributions that are to the right of it because the PGY2 score occurred at a point in time closer to when the pass-fail decision is made.
Although the probabilities cascade forward (to the right) with the most recent observed score overriding earlier scores, the BSP also shows the distributions cascading backwards (to the left).
In the case where you select both a PGY1 and a PGY2 score, the licensing examination score distribution at the far left will be updated to reflect the distribution of scores that likely generated the PGY1 score. This is not helpful for making predictions about passing, but it might be helpful in quantifying the degree of unexpectedness when something unpredicted has happened.
To really understand what the BSP is doing, it helps to play with it for a while. Do not worry about breaking it. It is a web-based application, so it is difficult to break.
v2018